Plate maps
Overview
A tool for capturing and visualizing experimental data
Plate maps provide scientists with easier ways to capture data and draw insights from plate-based experiments. The interactive interface allows users to visually annotate wells with experimental metadata, and fill plates with contents tracked in Benchling.
With over $3.75 million in lost ARR tied to this product gap since 2022, this release is crucial for scientists working in cell therapy, gene therapy, and antibody discovery across both mid-market and enterprise customers.
Minimize manual data entry
The previous product solution involved having to re-enter data into structured tables, and append custom columns to capture additional metadata

Surface insights faster
Visualizing relevant layers of metadata on a plate makes it faster to identify errors and draw insights about research programs

Preserve quality data
An immutable record of the actions taken on the plate is saved to the Notebook for data provenance and traceability
Problem
Experimental design and execution as the core problem
Lab work is commonly carried out in plates, yet Benchling's pre-existing plate entity lacked the ability to communicate content information, and capture rich metadata that ultimately aids in experimental analysis. Scientists often relied on point solution tools, Excel, or simple tables to achieve their goals.
Documents capturing customer complaints and user research anecdotes regarding plates date all the way back to 2018. As a result, both users and internal customer success teams have developed various workarounds that result in duplicated data and fragmented workflows.
Use cases
Plate maps have two primary use cases:
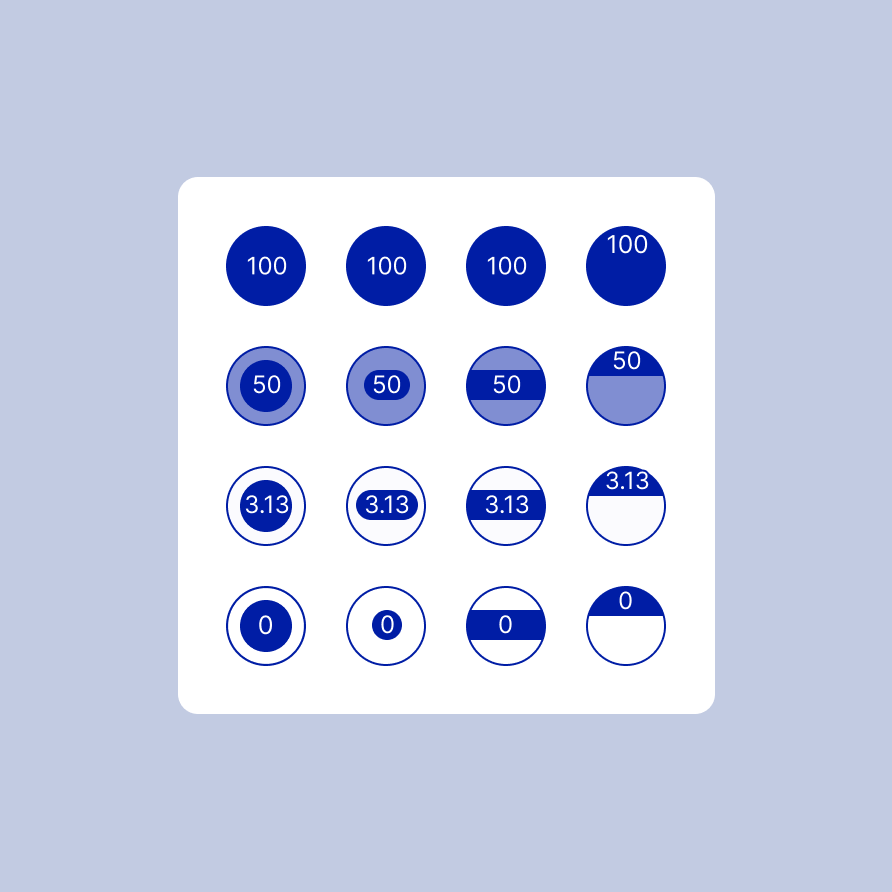
Visualizing experimental design - scientists need to plan in advance how a plate will be filled. This planning involves: arranging the contents, setting the volume, and capturing concentration values so that come time of execution (pipetting liquid into wells) the likelihood of error is reduced.
Capture metadata for experimental analysis - during downstream analysis, scientists rely on well-level metadata such as sample identity, conditions, and additional context to interpret results and understand how different variables may have influenced the outcome.

Solution
An interactive plate map to visually plan experiments and capture data
The plate map tool allows scientists to visually plan plate-based experiments and annotate metadata on a plate. The key considerations that influenced the designs were:
- Cross-app integration - the tool needed to be accessible across apps, specifically Inventory: where lab items are tracked, and Notebook: where experiment context is recorded.
- Build to scale - we optimized the experience for the most commonly used 96-well plates (12x8), but had to consider other varying dimensions from 8 wells (4x2) up to 384 wells (24x16)
- Visual satisfaction - the tool should match the user’s mental model of what a plate looks like when planning experiments (vs. a tabular view, which is more helpful when analyzing an experiment)
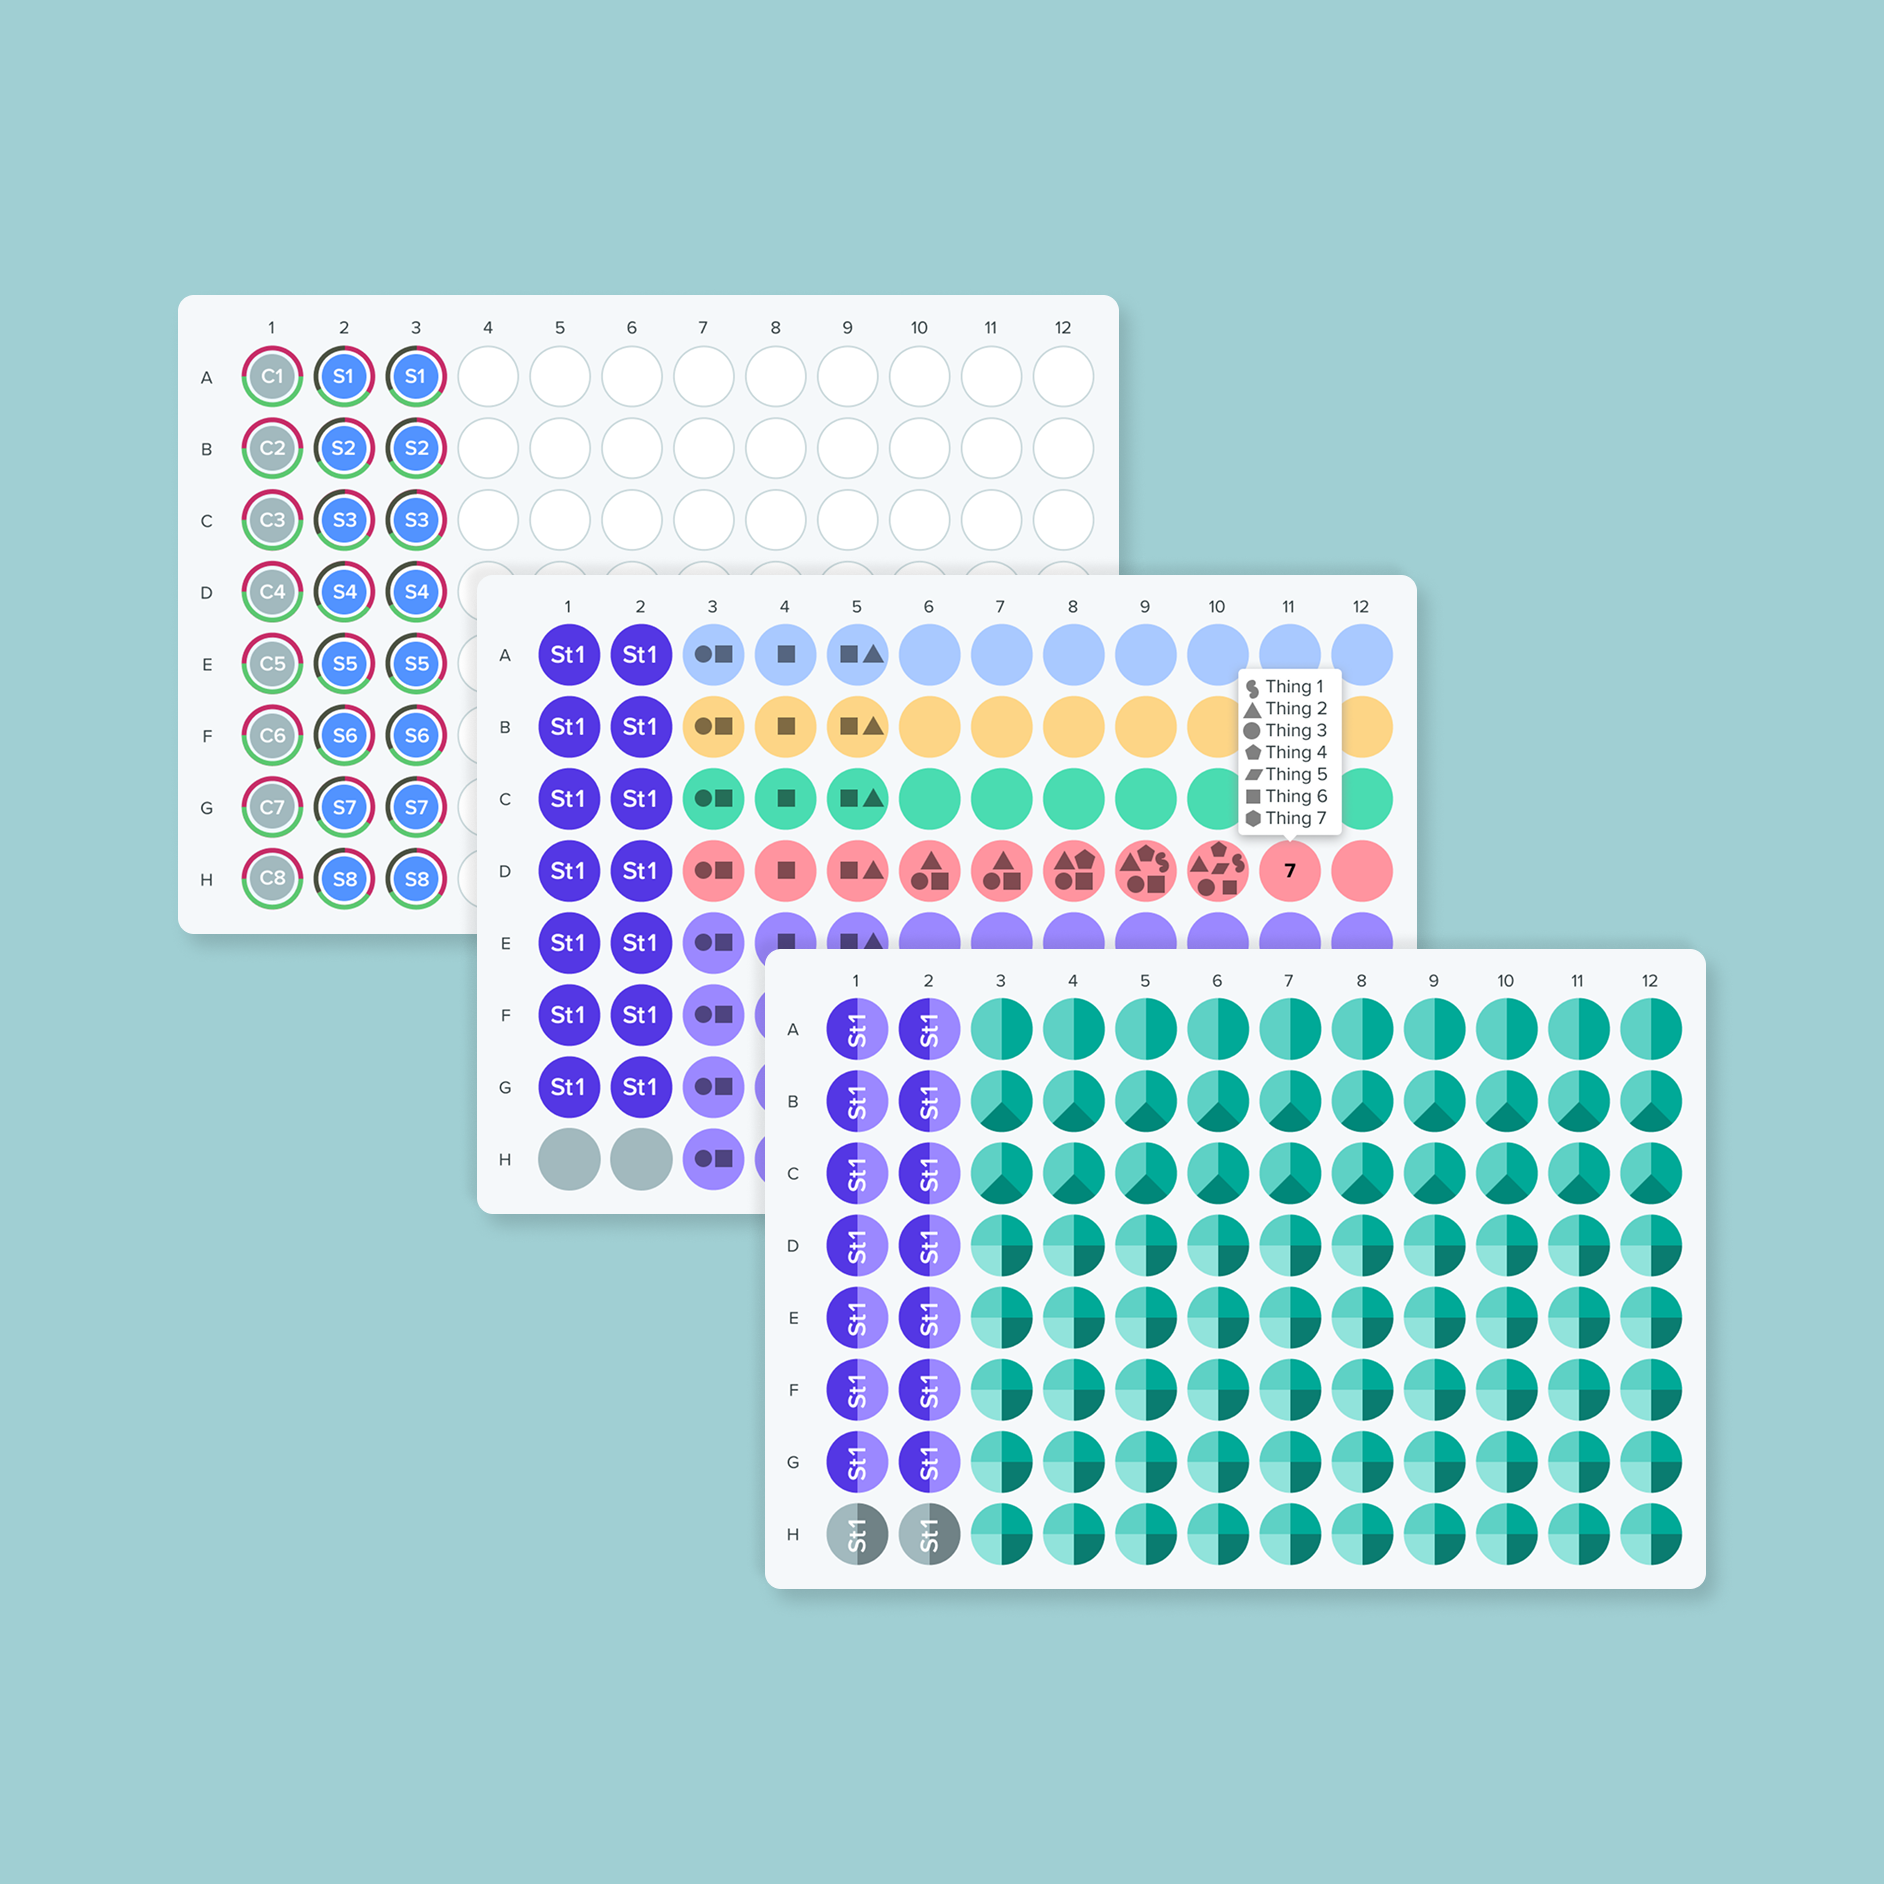
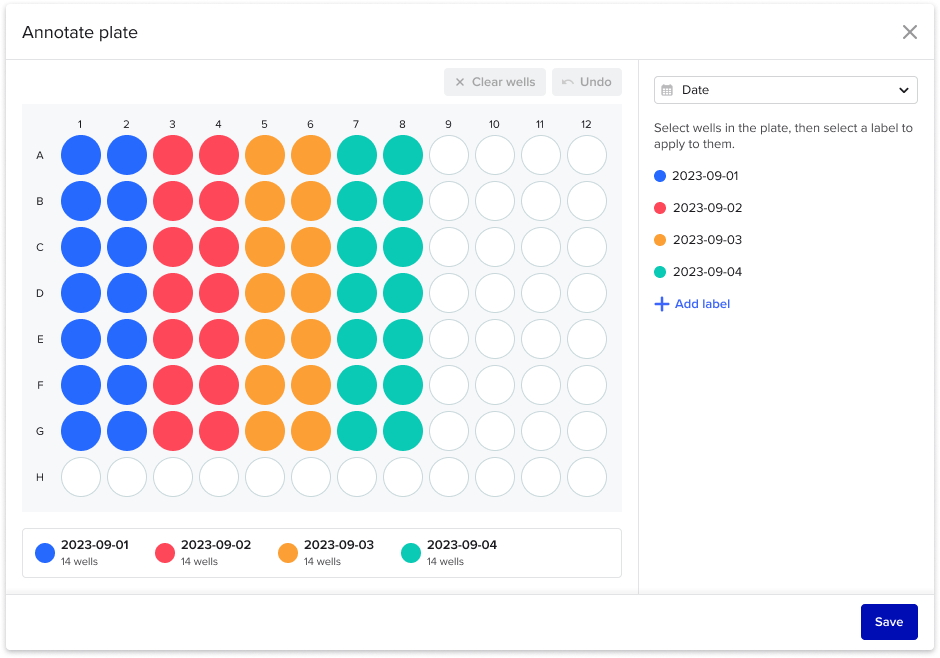
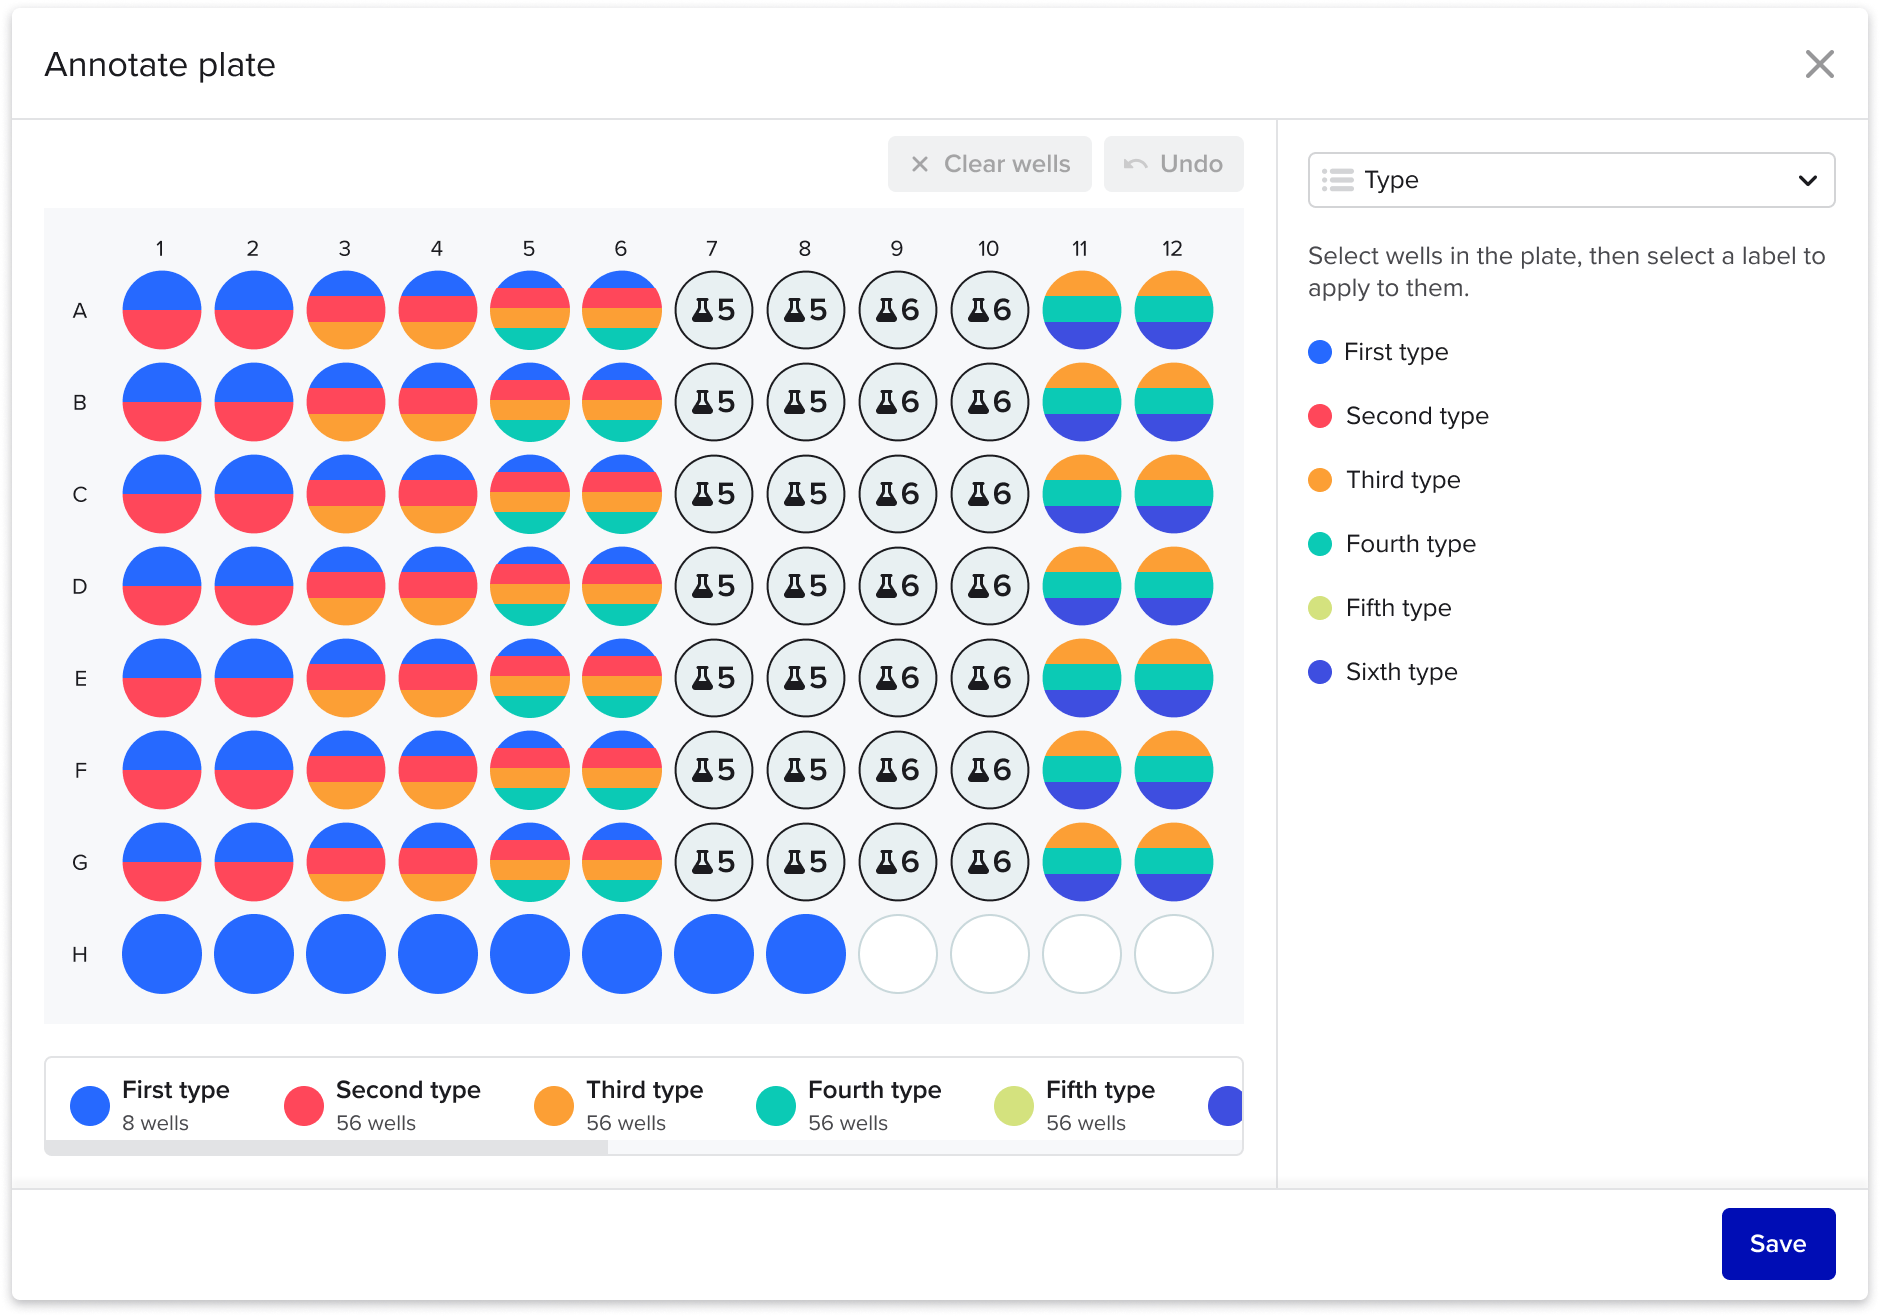
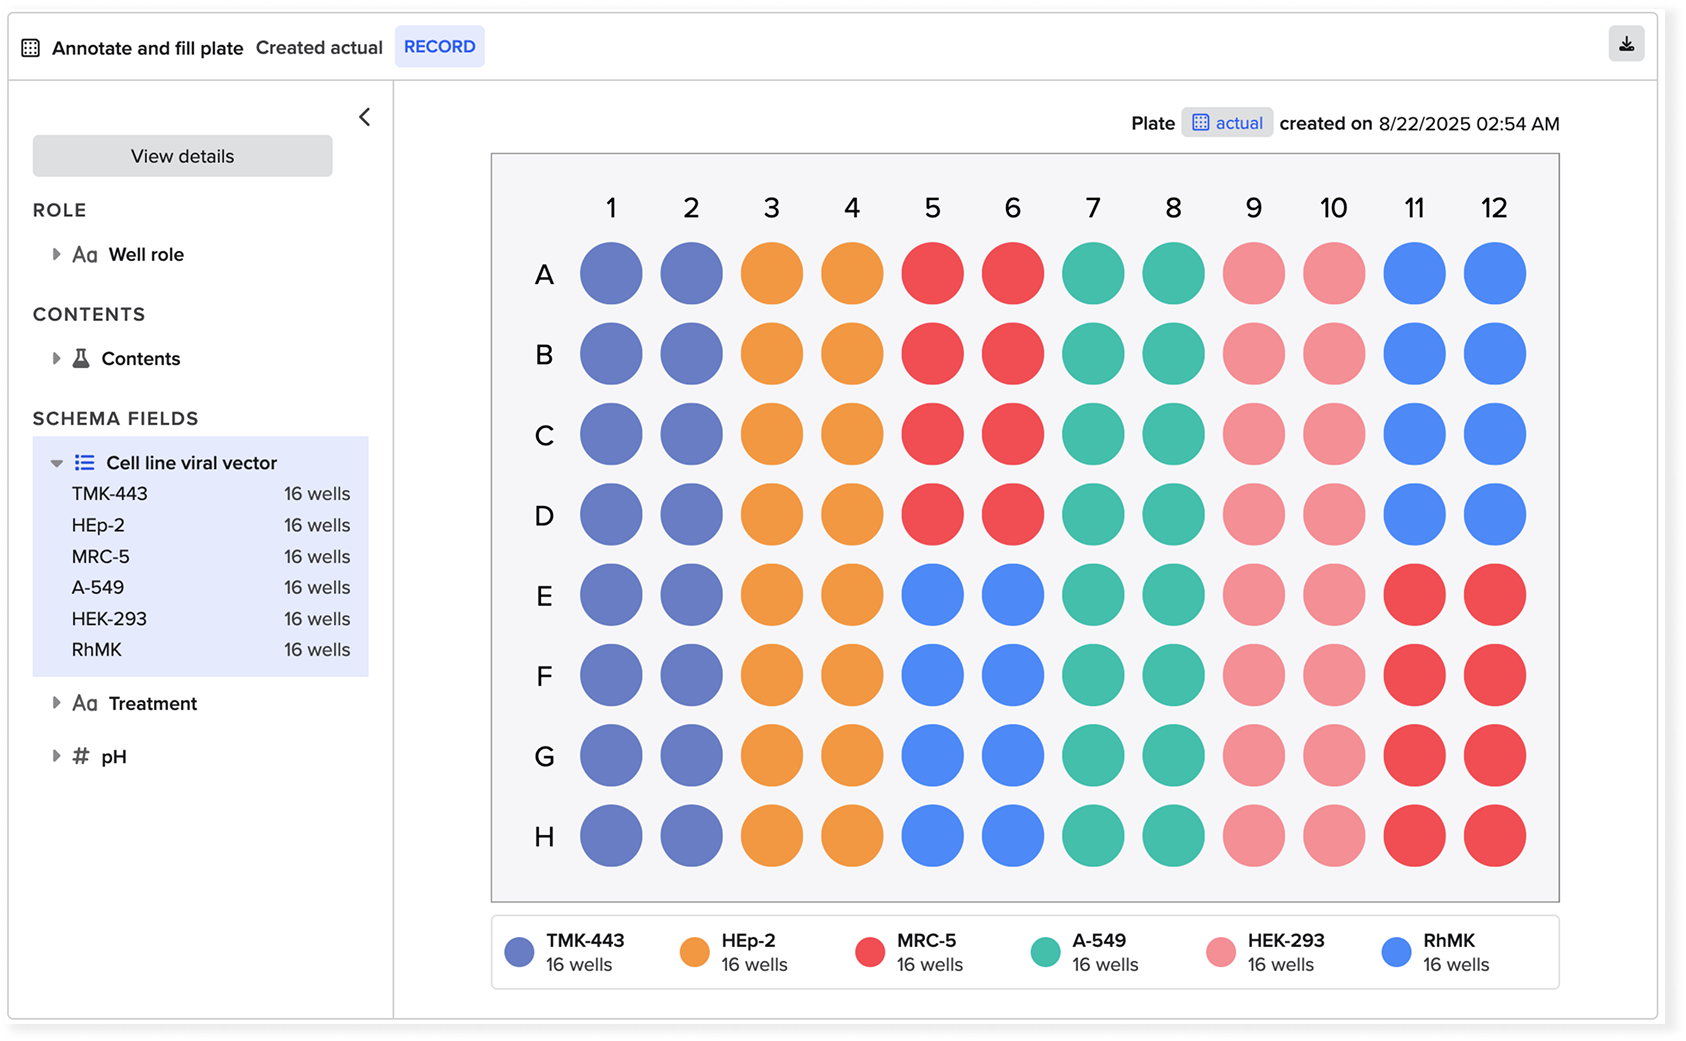
Annotating well metadata
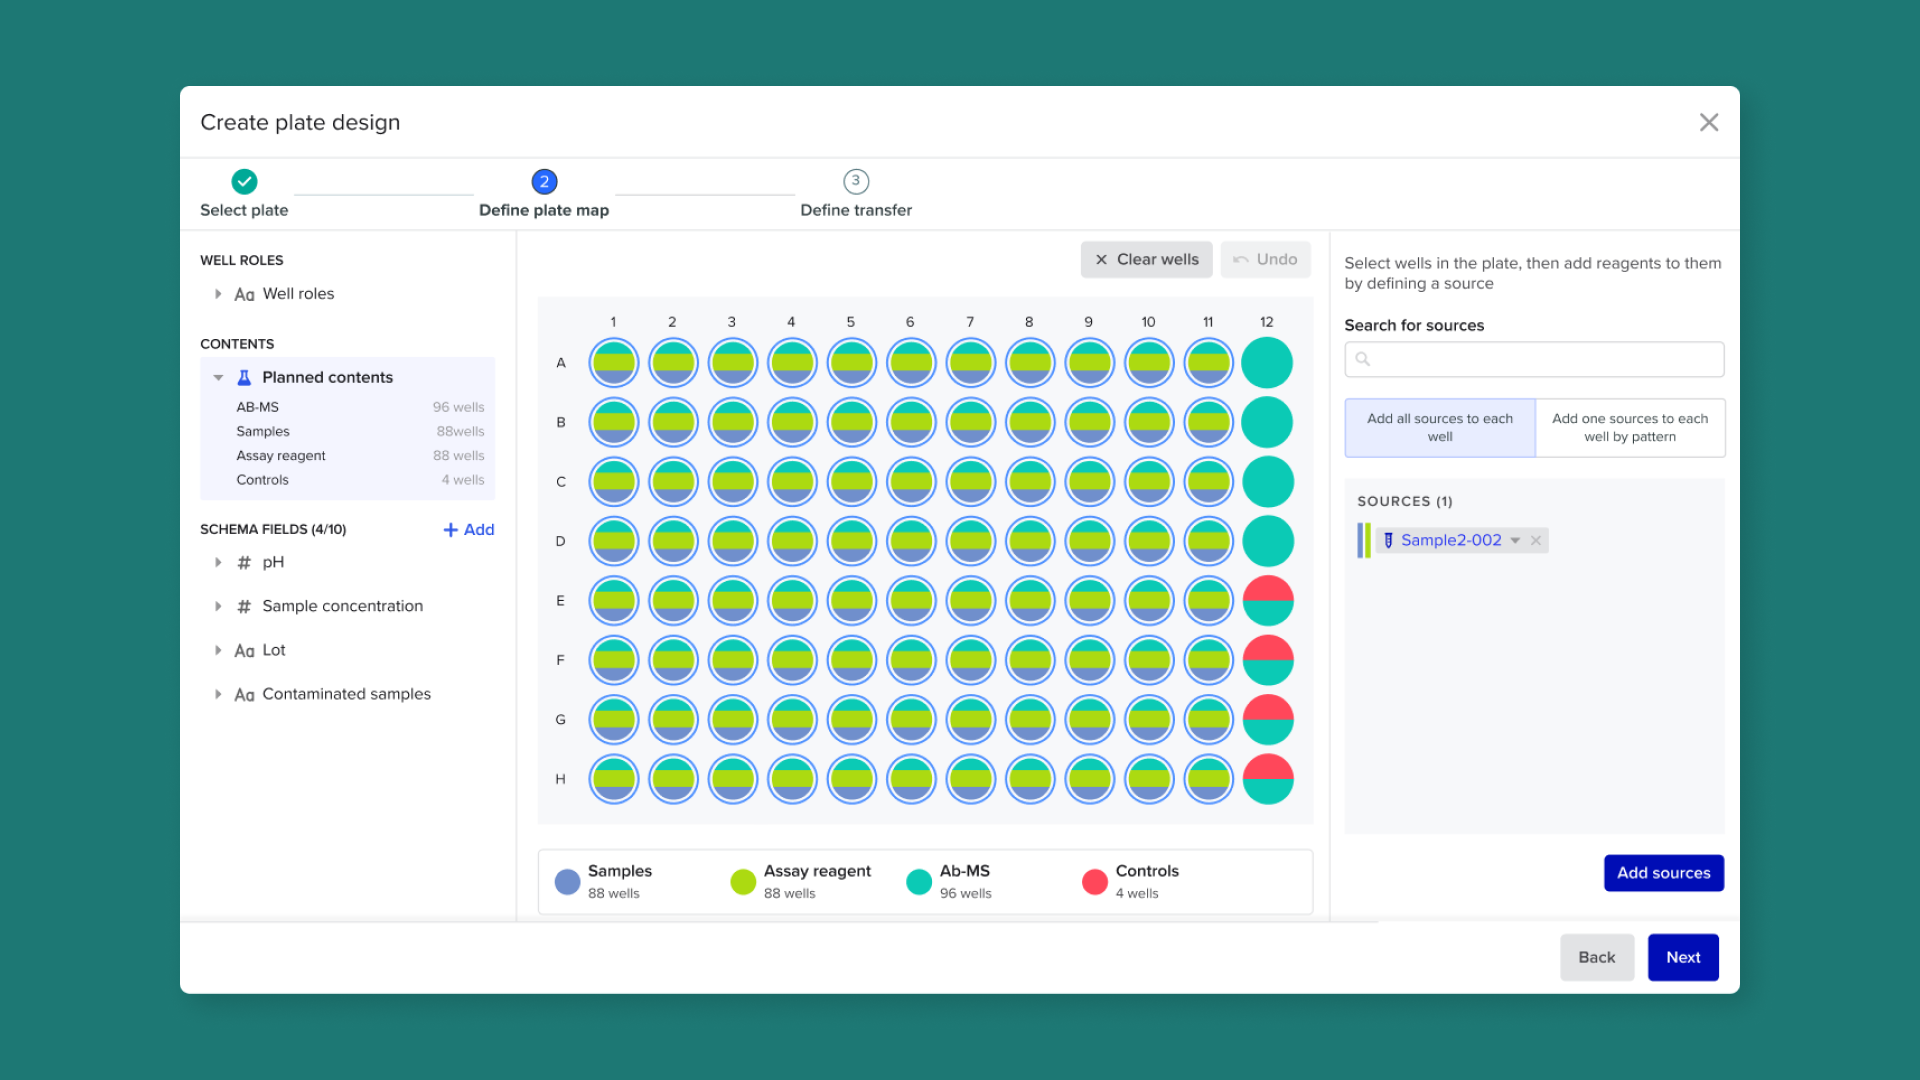
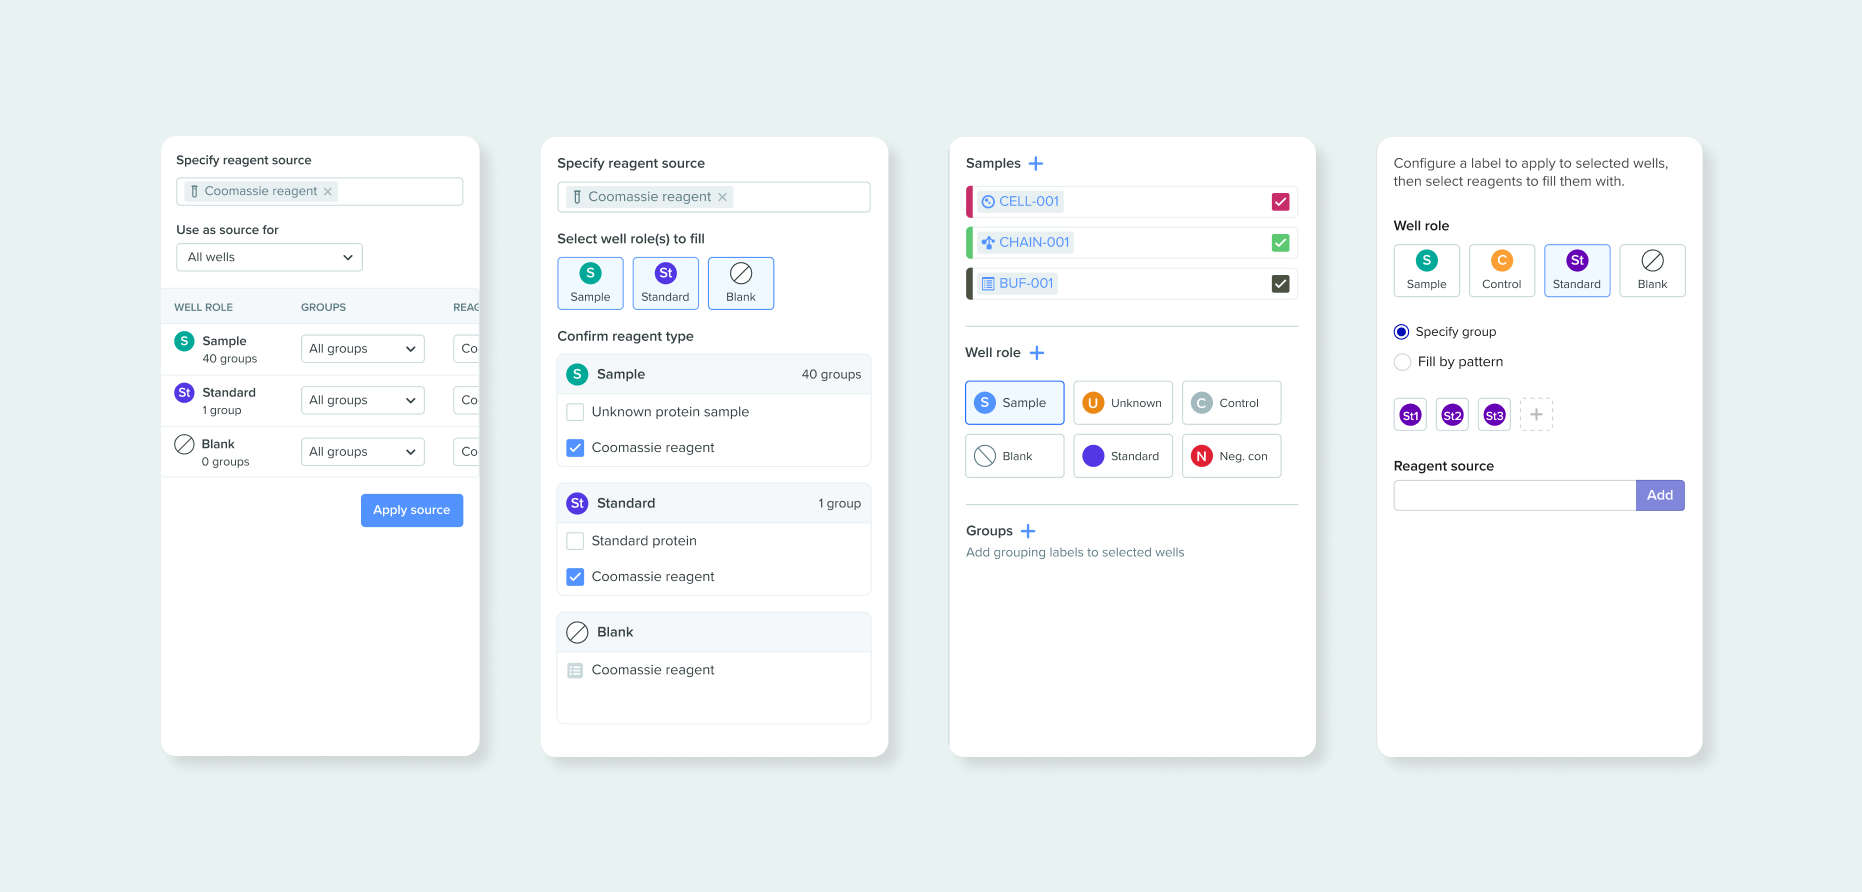
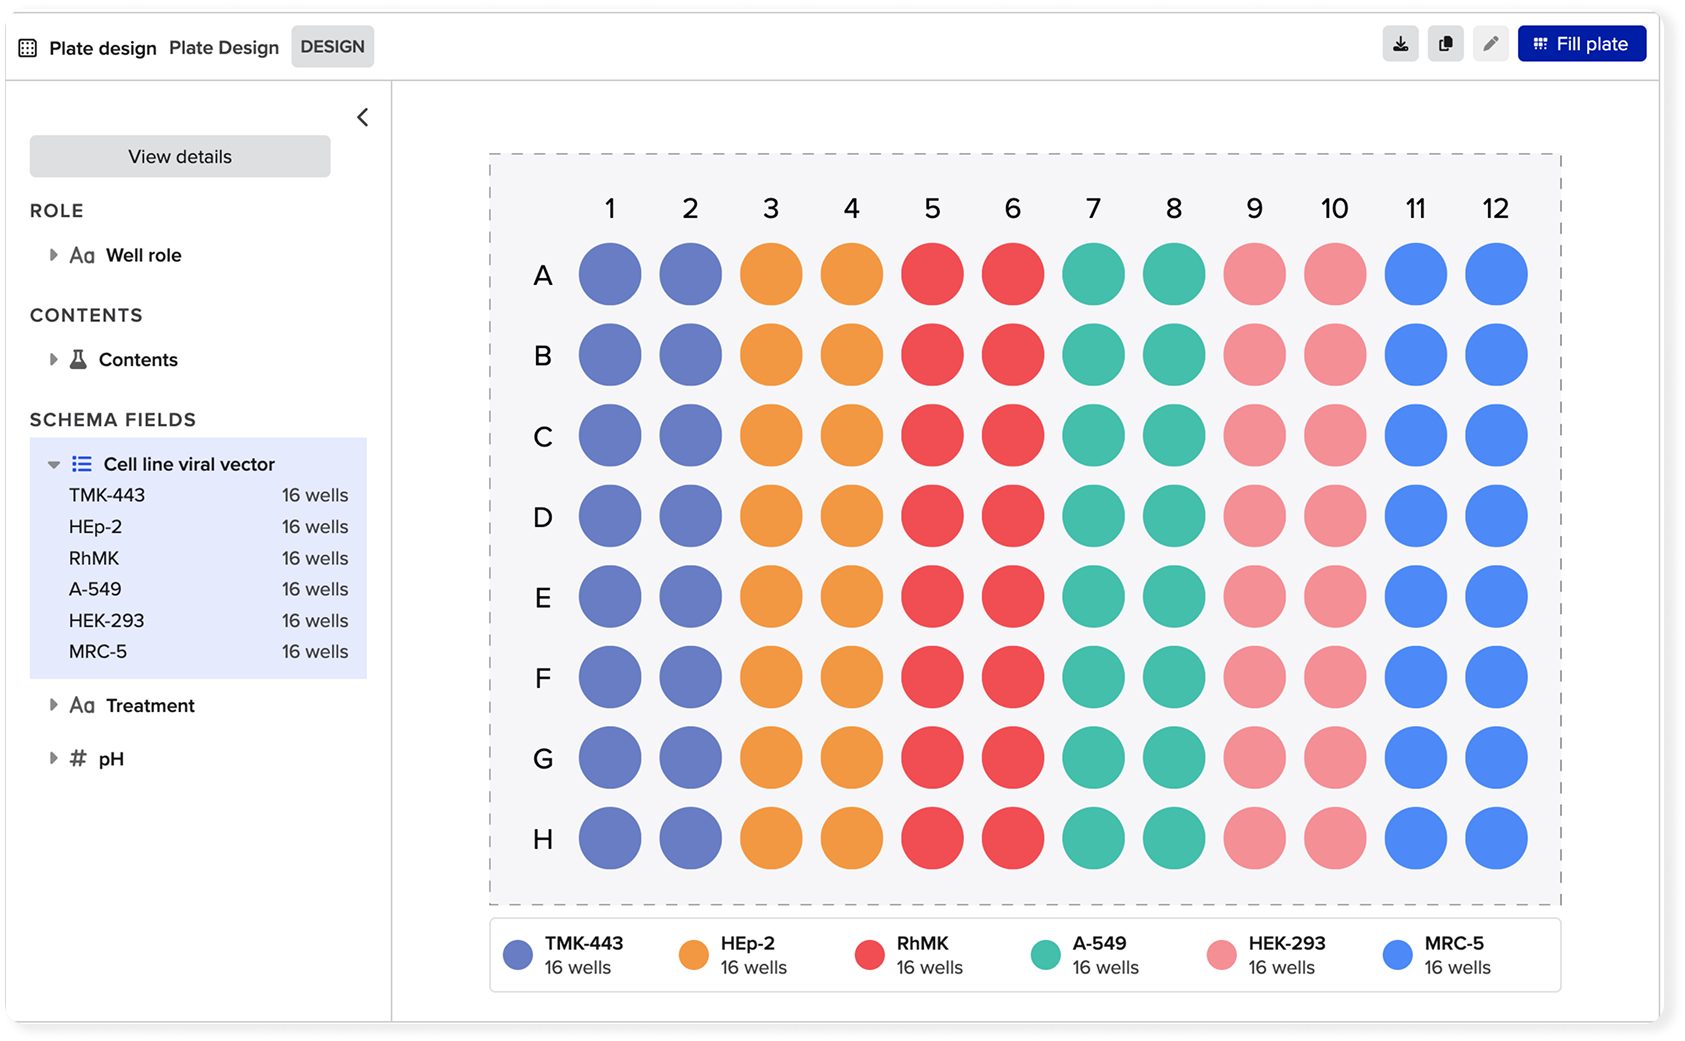
Filling wells with contents and defining transfer values

Outcome
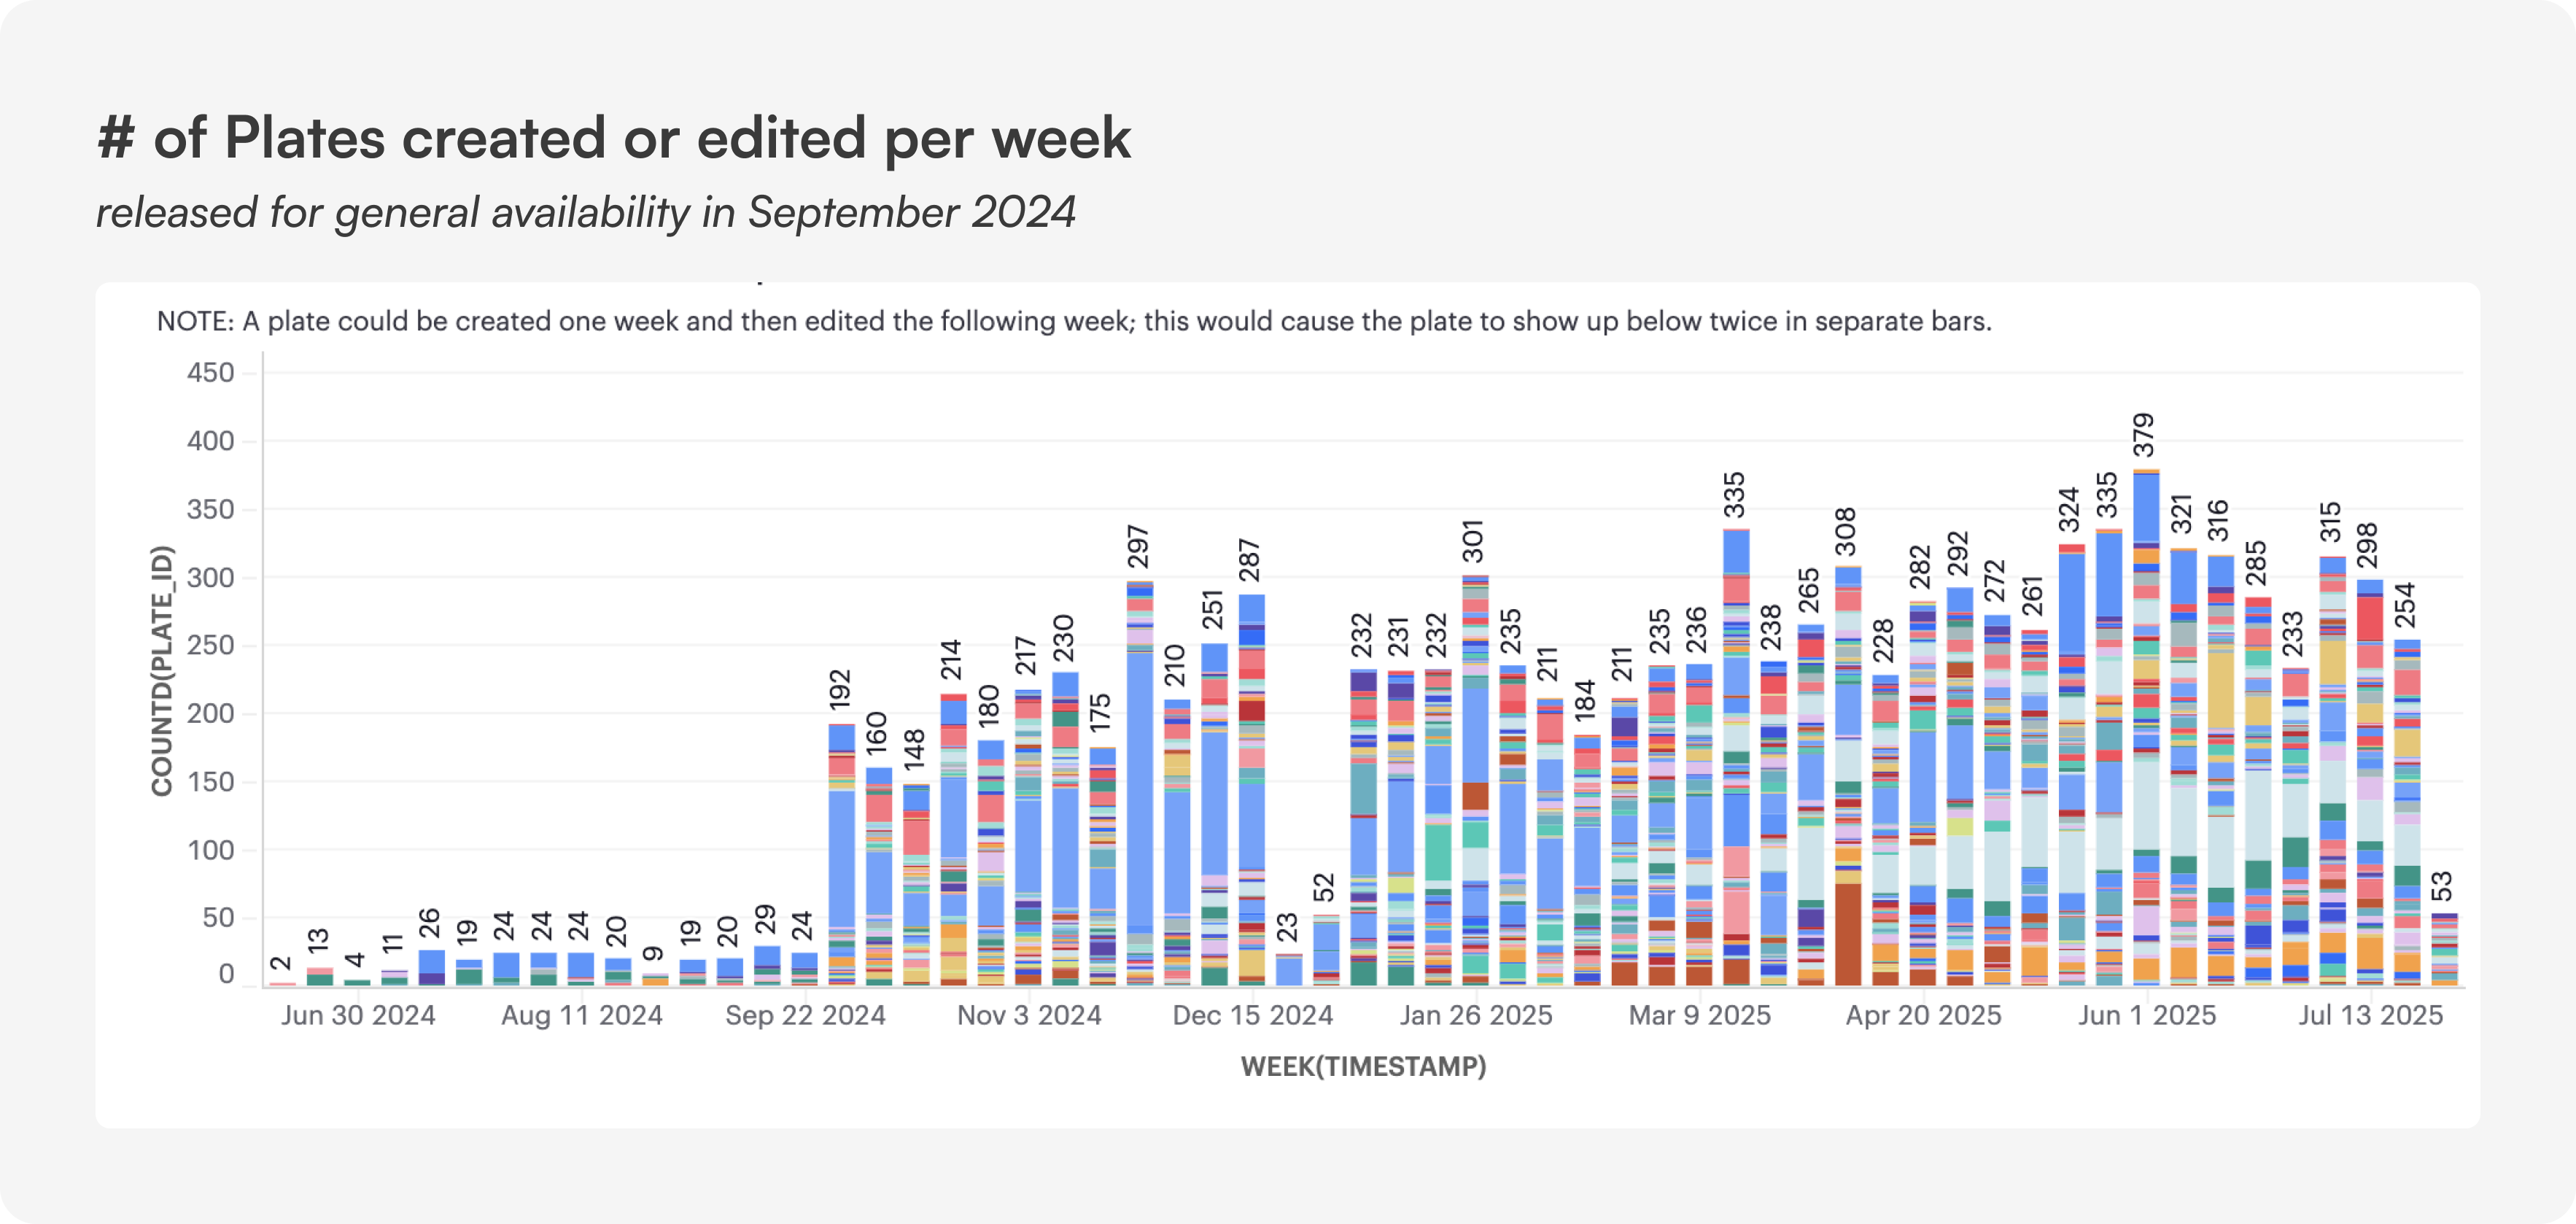
Rapid, broad, and deep customer adoption
Plate maps released for general availability in September 2024.
Within the first month...
- 850+ plates created
- Adopted by 116 customer accounts
- Utilized by 270 active users
Within the first year...
- 12.1K+ plates created
- Adopted by 333 customer accounts
- Utilized by 1,450 active users